Advanced Reporting now in First Bite CRM: Your pipeline questions answered
Track real-time pipeline health, campaign results, and rep activity inside First Bite. Use pre-built dashboards or build custom reports.



It’s the night before a quarterly business review, and leadership needs to know how much revenue is sitting in open deals. That usually means exporting from the CRM, cleaning up a spreadsheet, and building charts by hand. Then doing it all again next quarter.
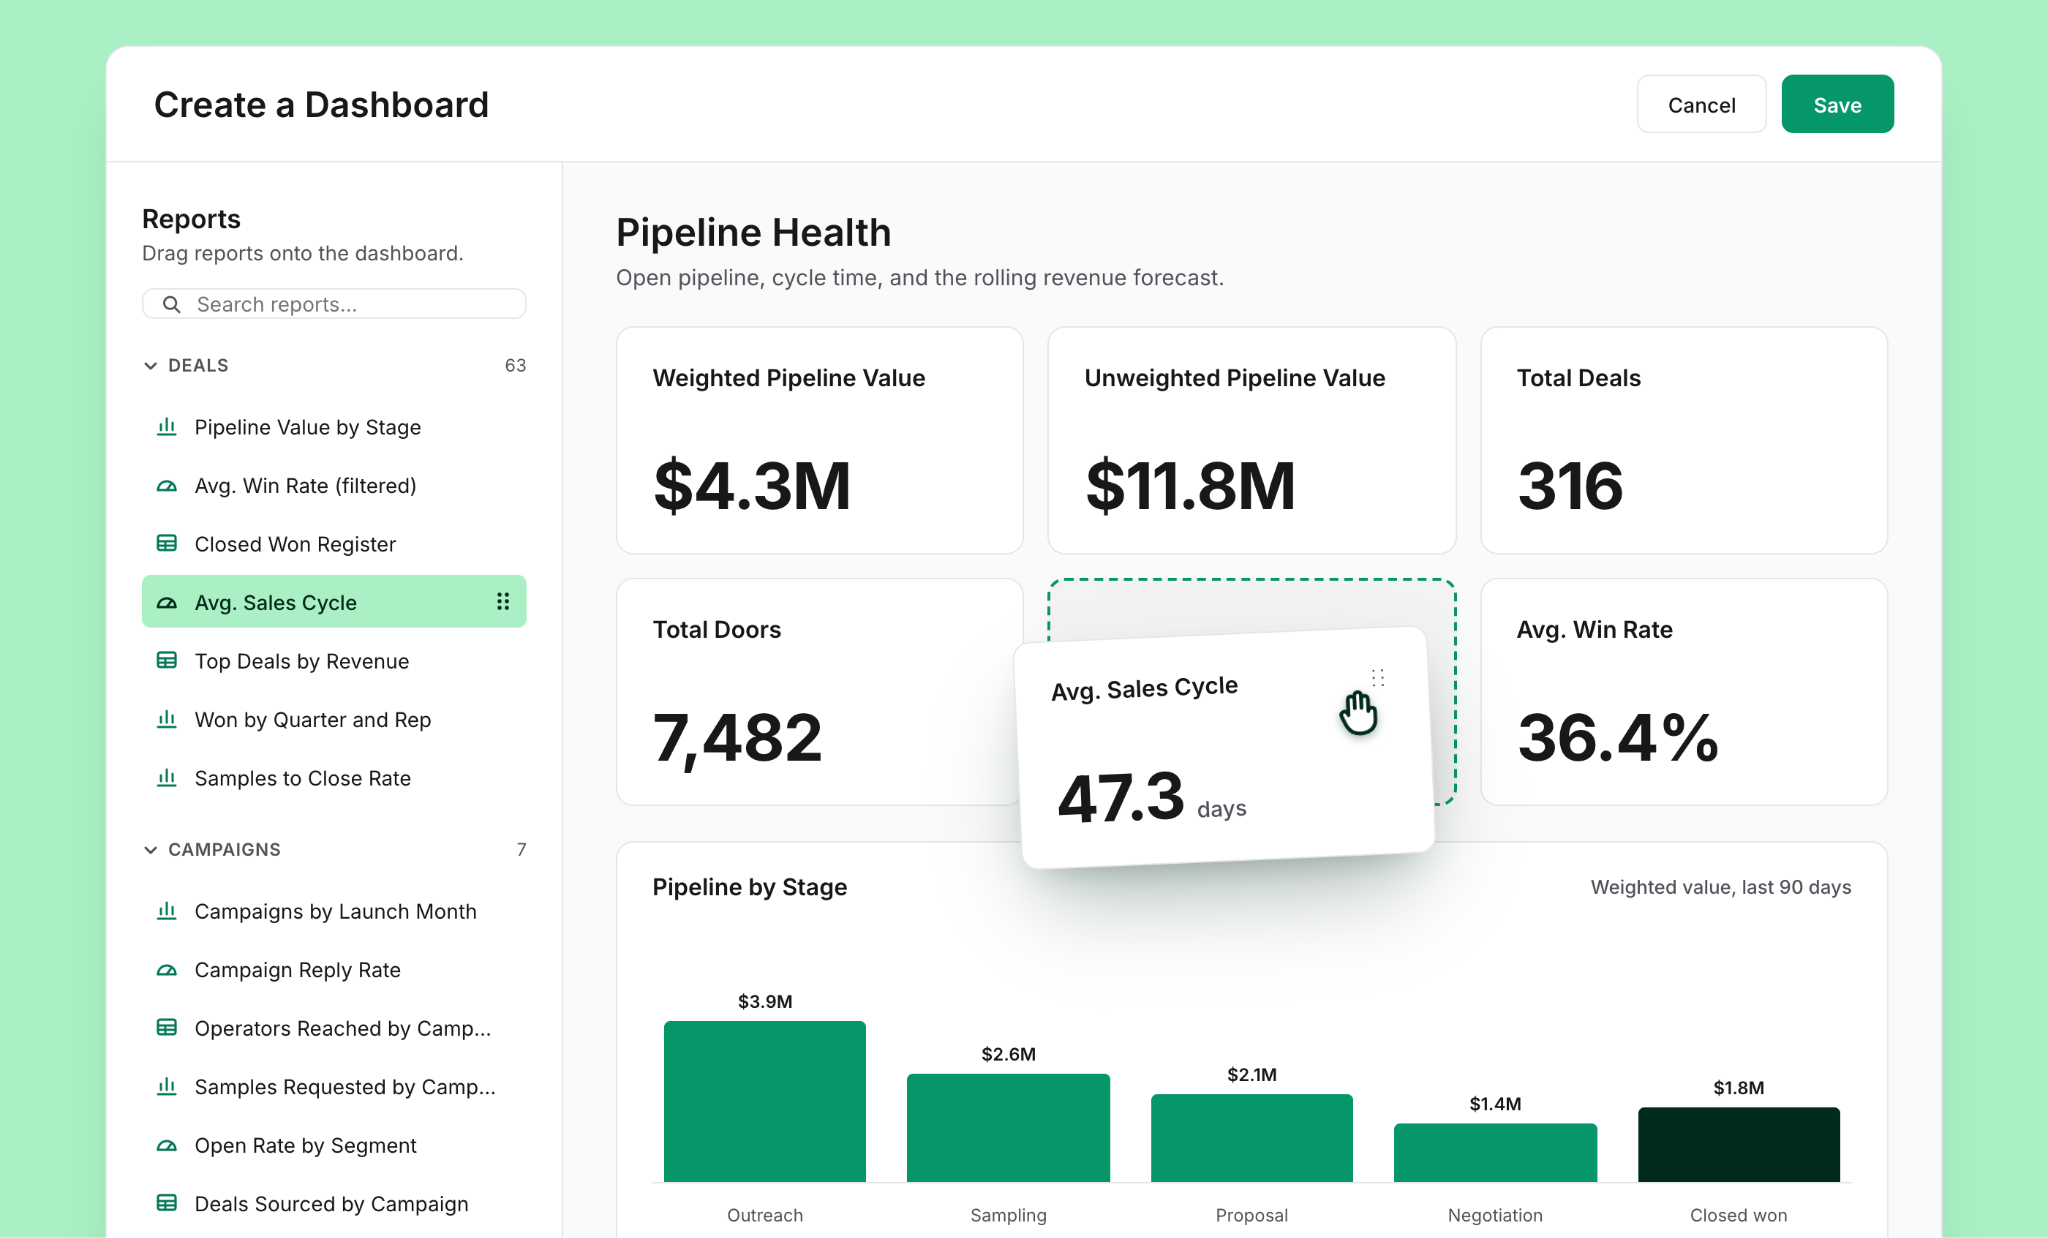
With First Bite’s Advanced Reporting, you can now get answers directly in the CRM. Select from pre-built dashboards, or build your own views from scratch with drag-and-drop widgets.
As one early user put it, “I literally just hook up my laptop and go on First Bite and I can click through and show real time metrics.” That’s the experience we set out to build.
Know where your pipeline stands
- Pipeline health: See open pipeline, cycle time, and your rolling revenue forecast at a glance.
- Pipeline management: Spot stale deals before they slip, and see every open deal by stage and how long it’s been there.
- Deal performance: Learn where you’re winning and where you’re losing, with win and churn rates and sales cycle by quarter, rep, category, and product.
- Deal activity: See the emails, calls, meetings, and notes behind every deal and every rep, right next to the pipeline they’re working.
See which operator outreach is paying off
- Campaign performance: Find out which campaigns get replies, how your emails are landing, and how results trend by month.
- Quarterly business review: Follow the full story from campaigns launched to the people reached, the replies, and the deals opened and won.
Track team activity
See the calls, meetings, and trade show conversations behind your pipeline, by team, region, or rep. Share the wins at your Monday meeting and spot the deals and regions that need a push.
Build a custom view
Tailor any pre-built dashboard by adding or removing the metrics your team tracks. Resize and rearrange each report so the numbers that matter most are front and center.
Zoom in on what matters
Filter any report or dashboard by date, owner, company, product or campaign. No need to create multiple views.
Control who has access
Keep reports and dashboards private while you work, or share them across your team so everyone is looking at the same numbers.
The most comprehensive CRM for foodservice sales
Advanced Reporting is First Bite’s latest step in providing an end-to-end platform for foodservice sales teams. Find operators, run outreach, manage deals, and track pipeline, all in one place.
Learn more about First Bite’s CRM
Read more

Introducing First Bite Rebates: Fixing the trade spend problem in foodservice

How to get more replies from foodservice operators: 1M+ emails analyzed

How to turn menu trends into foodservice sales opportunities
Start closing better foodservice deals today
